
Short answer: a fair value gap (FVG) is the price range that a fast three-candle move leaves untraded on one side. It is bullish when the third candle’s low is above the first candle’s high, and bearish when the third candle’s high is below the first candle’s low. In cTrader you can mark gaps by hand with the rectangle tool or with an indicator, and you should filter out the small ones with a size rule such as “at least 0.25 × ATR”. Most gaps are filled again: in our own twelve-month test on 15-minute charts, about 83–84 % were filled within 50 candles. Random zones of the same size and distance were filled about as often, so the fill itself is mostly a matter of distance, not a hidden force.
This guide shows how a gap forms, when it really exists, how to find and filter gaps in cTrader, and what our own numbers say about trading them. Every number comes from our own measurement, and the data sources are named at the end.
What a fair value gap is
Take three candles in a row. In a strong up move, the middle candle is large, and the third candle never trades back down to the high of the first one. The range between the first candle’s high and the third candle’s low was crossed by one candle only. That untraded range is the bullish fair value gap. A bearish gap is the mirror image: the third candle’s high stays below the first candle’s low.
- Bullish FVG: low of candle 3 > high of candle 1. The gap runs from the high of candle 1 (bottom) to the low of candle 3 (top).
- Bearish FVG: high of candle 3 < low of candle 1. The gap runs from the high of candle 3 (bottom) to the low of candle 1 (top).
- Midline: the 50 % level of the gap. In smart money concepts (SMC) and ICT material it is often called “consequent encroachment”.
The term comes from the ICT and smart money community, where traders also call the same pattern an imbalance or an inefficiency. The idea behind it is that price moved so fast that buyers and sellers did not trade at every level in that range. Whether that idea predicts anything is a separate question, and we measured it further below.
When a gap exists, and why some indicators repaint
A gap needs three closed candles. While candle 3 is still forming, its low (in a bullish case) can still fall below the high of candle 1, and then there is no gap at all. An indicator that draws a gap from the running candle will sometimes show a box and remove it a few seconds later. On a historical chart you never see those removed boxes, so the chart looks better than what you would have seen live.
The clean rule is: a gap becomes valid when candle 3 closes, so it is first visible on the open of candle 4. The box can still start at candle 2, because that is where the gap is on the chart. Filling works the other way round: once a later candle has traded through the gap, the fill is final, even if that candle is still running, because a candle’s low can only fall and its high can only rise while it forms.
The same applies to gaps from a higher timeframe. An H4 gap on a 15-minute chart exists only after the third H4 candle has closed. On TradingView this is the documented non-repainting form of request.security: an [1] offset together with lookahead = barmerge.lookahead_on (see the Pine Script page on repainting).
A worked example with real numbers
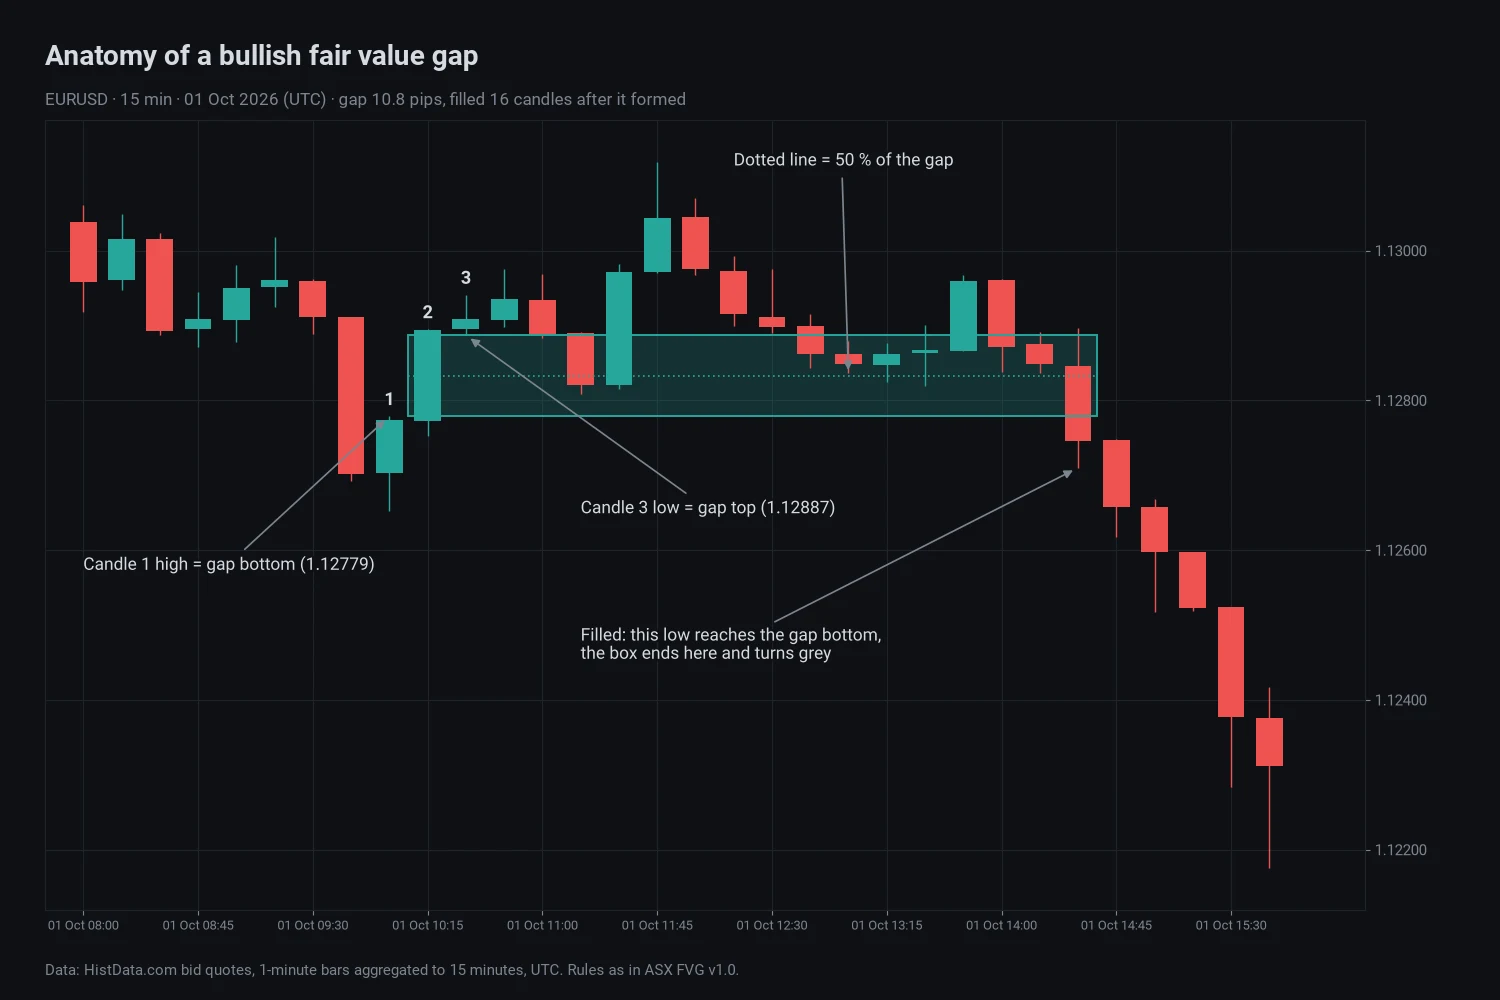
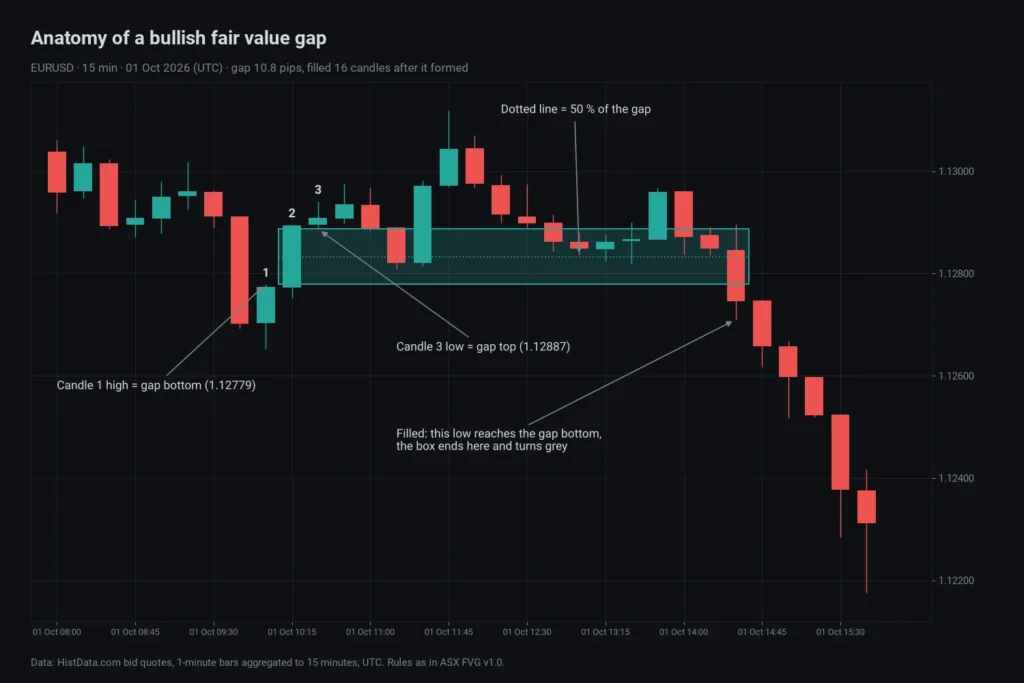
The chart above shows EURUSD on the 15-minute timeframe on 1 October 2026 (times in UTC):
- Candle 1 (10:00) has a high of 1.12779.
- Candle 2 (10:15) is the large move up, from 1.12773 to 1.12894.
- Candle 3 (10:30) has a low of 1.12887.
The low of candle 3 is above the high of candle 1, so there is a bullish gap from 1.12779 to 1.12887: 10.8 pips, with the midline at 1.12833. The 14-period ATR at candle 3 was 9.25 pips, so the gap was 1.17 ATR, a large one. With a filter of 0.25 × ATR (2.3 pips at that moment) it clearly passes. The gap became valid at 10:45, when candle 3 closed.
Price traded back into the gap several times without reaching its bottom, and at 14:30 a candle’s low reached 1.12710, below the gap’s bottom. The gap was filled 16 candles, or four hours, after it formed. In our twelve-month EURUSD sample, gaps of at least 1 ATR were filled within 50 candles 61.3 % of the time, so this one was ordinary.
How to find fair value gaps in cTrader
By hand
- Open a chart, for example M5 to H1, and look for a large candle.
- Compare the high of the candle before it with the low of the candle after it (for an up move). If the low is higher, there is a gap.
- Draw a rectangle from the first candle’s high to the third candle’s low and extend it to the right until price trades through it.
This works for a few gaps, but on a 15-minute chart you will find around 20 gaps a day on EURUSD if you count every one, and it is easy to miss or misjudge the small ones.
With an indicator
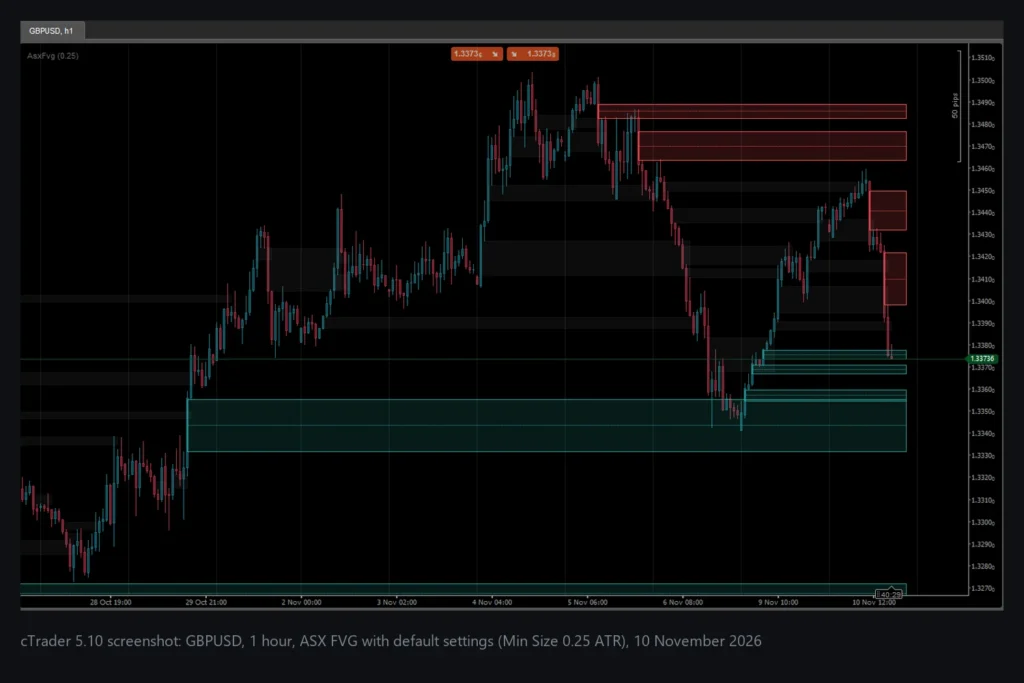
An indicator applies the rule the same way every time. Our free ASX FVG for cTrader draws bullish gaps in teal and bearish gaps in red, adds the midline, turns a gap grey when it is filled and can add the gaps of a higher timeframe. It only uses closed candles. To use it:
- Download the ZIP and double-click
AsxFvg.algo. cTrader installs it, as described in cTrader’s help page on installing a custom indicator. Our guide to installing .algo files covers the same steps with screenshots. - On the chart, click the indicator icon, search for AsxFvg and add it (see cTrader’s page on using an indicator).
- Leave Min Size (ATR) at 0.25 to start. Only this value appears in the chart title, so you always see which filter is active.
How to filter gaps: the ATR size rule
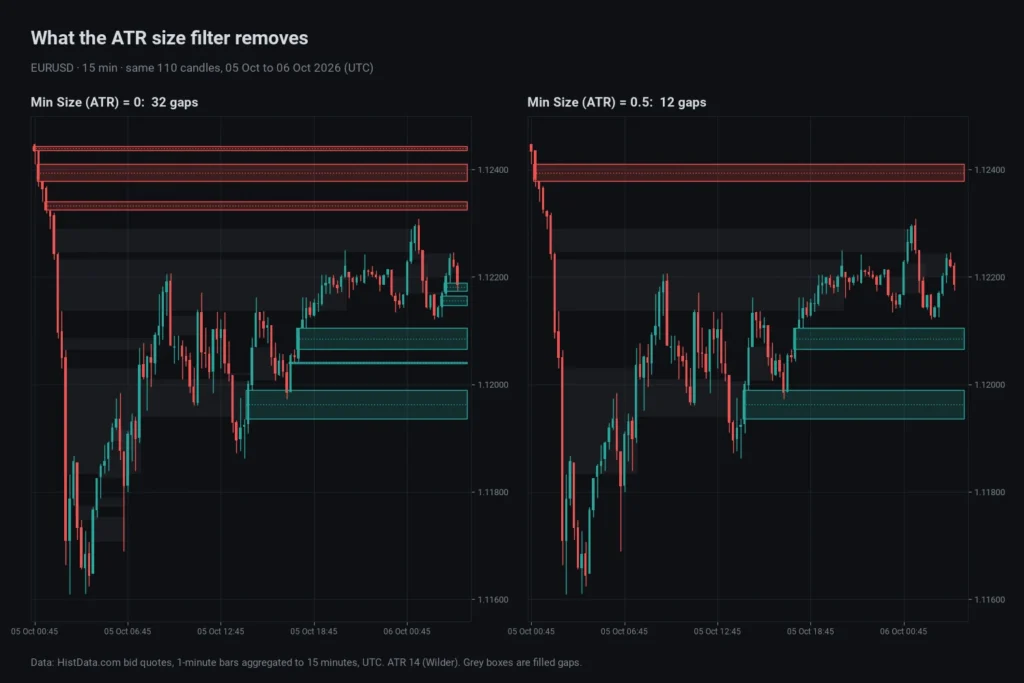
Many gaps are tiny, a fraction of a pip on EURUSD or a few cents on gold. A fixed pip size does not work across markets and changes meaning when volatility changes. A size rule in ATR units does both: “keep a gap only if it is at least k × ATR(14)”. This is how many gaps per day each setting leaves on the 15-minute chart:
| Min size | EURUSD | Gold (XAUUSD) | BTCUSDT |
|---|---|---|---|
| 0 (every gap) | 20.5 | 19.7 | 22.3 |
| 0.1 × ATR | 16.5 | 15.4 | 17.4 |
| 0.25 × ATR | 11.1 | 10.2 | 11.9 |
| 0.5 × ATR | 5.5 | 4.8 | 6.2 |
| 1.0 × ATR | 1.5 | 1.2 | 1.8 |
Gaps per 24 hours of trading, 1 November 2025 to 31 October 2026, ATR with Wilder smoothing. A setting of 0.25 removes about half of all gaps, and almost all of the removed ones are the tiny boxes that clutter the chart. At 1.0 you keep only one or two gaps a day.
Do fair value gaps get filled? What our data shows
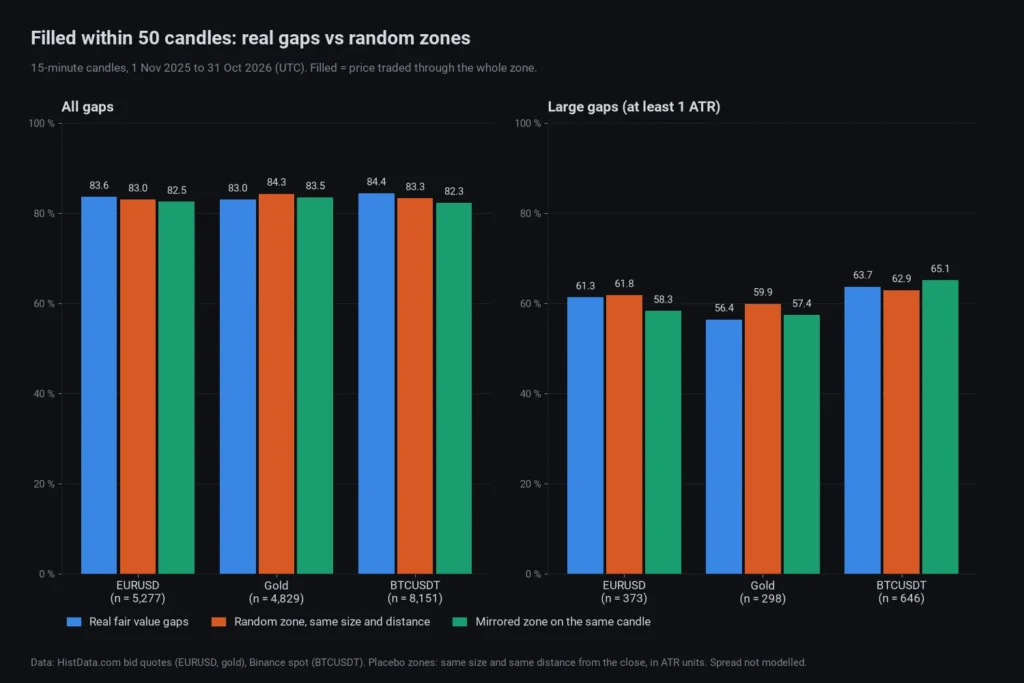
We counted every gap on EURUSD, gold and BTCUSDT 15-minute charts over twelve months and checked three things: whether price came back into the gap (“touched”), reached its midline, or traded through all of it (“filled”). Then we compared each real gap with two placebo zones: a zone of the same size and the same distance from the close, placed on a random candle at the same hour of day, and a mirrored zone on the other side of the same candle. If gaps really pull price back, real gaps must be filled more often than the placebos.
| Filled within 50 candles | EURUSD | Gold | BTCUSDT |
|---|---|---|---|
| Real gaps (all sizes) | 83.6 % | 83.0 % | 84.4 % |
| Random zone, same size and distance | 83.0 % | 84.3 % | 83.3 % |
| Mirrored zone, same candle | 82.5 % | 83.5 % | 82.3 % |
| Real gaps of at least 1 ATR | 61.3 % | 56.4 % | 63.7 % |
| Median candles until filled (all / at least 1 ATR) | 5 / 27 | 5 / 41 | 5 / 23 |
What this means in plain words:
- Most gaps are filled, and quickly. Half of all gaps were filled within five candles, about an hour on M15.
- Random zones are filled about as often. The differences between real gaps and the placebos are around one percentage point and go in both directions; at 200 candles none of the three markets showed a clear difference. Small zones close to price get revisited simply because price moves around.
- Within the first ten candles, real gaps were filled slightly more often on EURUSD (+2.1 points) and BTCUSDT (+2.4 points) but slightly less often on gold (−1.5 points). That is not a consistent pattern.
- Large gaps are filled less often and more slowly, because their far edge is further away. Again, random zones at that distance behaved much the same.
- The higher timeframe did not change the picture. Whether the latest H4 gap pointed the same way changed the 15-minute fill rate by at most about 1.5 percentage points.
Trading fair value gaps: what the numbers do and do not support
The most common way traders use gaps is to wait for price to return to the gap and treat its near edge or midline as a place where the earlier move might continue. We tested the simplest version of that: when price first touches the near edge, does it move 1 ATR away from the gap before it moves 1 ATR through it?
- For all gaps it was a coin flip: 49.0 % on EURUSD, 48.7 % on gold and 47.3 % on BTCUSDT, with the placebo zones within about one and a half points of those values.
- For large gaps (at least 0.5 ATR) real gaps held a few points more often than the placebos, and that held up in a second, untouched year (November 2024 to October 2025): 48.6 % against 44.3 % and 46.3 %. But 48.6 % is still below 50 %. With 1 ATR targets and stops and our assumed round-trip costs (0.6 pip on EURUSD, 0.30 USD on gold, 0.1 % on BTCUSDT) the result was about −0.27 R per trade in both years.
So a gap on its own is not an edge in our data. That does not make gaps useless. They are an objective way to mark where price moved fast, they give you a reference level to plan around, and they make a fast move easy to see on a crowded chart. If you build a strategy around them, add something that the gap alone does not give you, test it on data the idea has not seen, include spread and commission, and run it on a demo account first. Our guide to SMC and ICT indicators on cTrader shows the same kind of test for order blocks.
Higher-timeframe gaps on a lower-timeframe chart
Many traders watch the gaps of a higher timeframe, such as H4, while they work on M15. Two rules keep this honest. First, the H4 gap may only appear when its third H4 candle has closed; until then it is not a gap. Second, the box starts at the middle H4 candle, so it reaches back in time, but you could not have known about it before the H4 close. ASX FVG draws such gaps with a dashed border (a thicker outline in MetaTrader 5) and a timeframe label, and it adds them only from closed higher-timeframe candles.
Limitations of this guide and of FVG indicators
- We tested 15-minute charts of three markets for one year, plus one extra year for the large-gap check. Other timeframes and markets can behave differently.
- The fill counts use price only (bid prices for EURUSD and gold, trade prices for BTCUSDT). They are not trading results, and spread is not included.
- Gaps depend on the data feed. Two brokers can show slightly different gaps on the same chart, especially on lower timeframes.
- An FVG indicator shows where gaps are. It does not tell you which one price will react to.
ASX FVG: a free FVG indicator for cTrader, MT5 and TradingView
We built ASX FVG to apply exactly the rules in this guide, with the same defaults on every platform: closed candles only, a minimum size in ATR, filled gaps in grey and optional higher-timeframe gaps. It is free and open source, with no license key:
- ASX FVG for cTrader (.algo file plus C# source)
- ASX FVG for MetaTrader 5 (.ex5 file plus MQL5 source)
- ASX FVG for TradingView (Pine Script v6)
More free and paid tools for cTrader are listed on our cTrader indicators page. Trading forex, metals and crypto with leverage can lose you money quickly; gaps describe where price has been, not where it will go.
FAQ
Is a fair value gap the same as an imbalance?
Mostly yes. In SMC and ICT material both words usually describe the same three-candle gap. Some traders use “imbalance” more loosely for any fast one-sided move. ASX FVG uses the strict three-candle rule.
Do fair value gaps repaint?
The pattern itself does not, but an indicator can. If it draws a gap while the third candle is still forming, the gap can appear and disappear. A gap drawn from closed candles only, as ASX FVG does, stays once it is on the chart.
What minimum size should I use?
Use a size relative to ATR rather than in pips. On 15-minute charts, 0.25 × ATR left about 10 to 12 gaps a day in our data and 0.5 × ATR about 5 to 6. Choose the setting that leaves a chart you can still read.
How often do fair value gaps get filled?
In our twelve months of 15-minute data, about 83–84 % within 50 candles and about half within five candles. Random zones at the same distance were filled about as often, so a high fill rate alone does not show that gaps attract price.
Which timeframe is best for fair value gaps?
We only measured the 15-minute timeframe in detail, so we cannot rank timeframes. Higher-timeframe gaps are larger and rarer; on lower timeframes there are more gaps and more noise. Whatever you use, apply the same closed-candle rule on every timeframe.
Data and sources (checked November 2026): EURUSD and XAUUSD 1-minute bid bars from HistData.com, cross-checked against Dukascopy for sample days, and BTCUSDT 15-minute candles from Binance public data; all aggregated to 15-minute candles in UTC, 1 November 2025 to 31 October 2026 (large-gap check also November 2024 to October 2025). Platform steps checked against help.ctrader.com and the TradingView Pine Script documentation.