
Short answer: a liquidity sweep is a candle that trades through an obvious high or low, such as equal highs, equal lows or the previous day’s high, and then closes back inside. Traders call it a stop hunt because stop orders tend to rest just beyond those levels. You can only call a sweep once the candle has closed: until then, the same candle can still close beyond the level and become a break. In our own measurement on two years of 15-minute data, the first trade-through closed back inside only 41–49 % of the time, and what came after a sweep was no different from what came after a random candle at the same hour.
This guide explains what “liquidity” means in this context, how equal highs, equal lows and the previous day’s and week’s highs and lows are defined, how to tell a sweep from a break, and what our numbers say about trading them. Every number comes from our own measurement, and the data sources are named at the end.
What “liquidity” means here
In this context, liquidity means resting orders. Many traders place a stop-loss just above a recent high when they are short, and just below a recent low when they are long. Breakout traders place buy-stop orders above highs and sell-stop orders below lows. So the area just beyond an obvious high or low is where a cluster of stop orders is likely to sit. In smart money concepts (SMC) and ICT material, the orders above highs are called buy-side liquidity and the orders below lows sell-side liquidity.
The clustering itself is documented. A study by Carol Osler at the Federal Reserve Bank of New York found that stop-loss orders in currency markets cluster just beyond round numbers, and that exchange rates moved unusually fast once they reached those levels, an effect that lasted for hours rather than days (Staff Report 150, 2002). What the study does not show is that price reliably turns around after it has taken those stops. That second claim is what most “stop hunt” strategies depend on, and it is the part we measured below.
Equal highs, equal lows and the previous day’s high and low
Three kinds of levels are commonly treated as liquidity pools:
- Equal highs (EQH) and equal lows (EQL): two swing highs (or lows) at almost the same price. A double top leaves stops of many traders above one price, so it is a more obvious target than a single high.
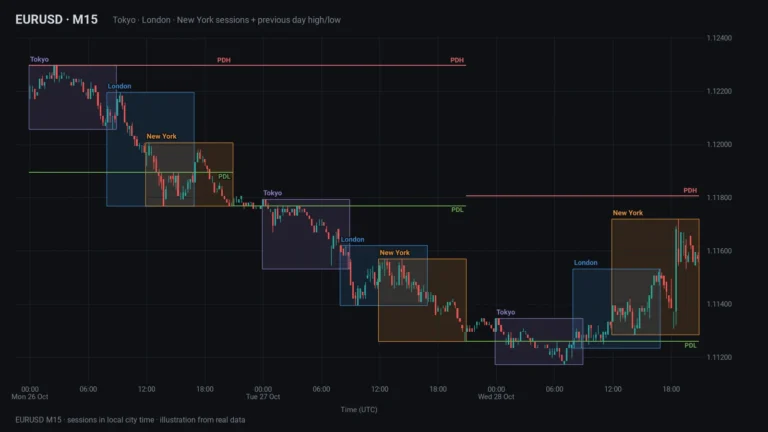
- Previous day high and low (PDH, PDL): the high and low of yesterday’s daily candle. They are the most widely watched intraday levels.
- Previous week high and low (PWH, PWL): the same on the weekly candle.
“Almost the same price” needs a number, or every chart reader sees different equal highs. We use a tolerance in ATR units: two swing highs count as equal when they are at most 0.1 × ATR(14) apart, measured when the second swing is confirmed. ATR scales with volatility, so the same setting works on EURUSD, gold and Bitcoin and on different timeframes. A swing high needs a higher high than the three candles before it and a high not lower than the three candles after it. Both swings must be at most 500 candles apart, and no candle in between may have traded above the higher of the two; otherwise that level was already taken. The level itself is the higher of the two highs, because the stops sit above both.
Sweep or break: why the close decides
When a candle trades through a level, two things can happen by the time it closes:
- Sweep: the candle closes back inside, for example below an equal-highs level after its high traded above it. The wick took the stops, the body did not hold beyond the level.
- Break: the candle closes beyond the level.
The difference only exists at the close. While the candle is still forming, its high can be above the level and its current price below, and a minute later the price can be above the level again. An indicator that marks sweeps on the forming candle will show labels that later disappear. That is why we only judge closed candles, and why a level is only marked as equal highs once the second swing has been confirmed three candles later. A close exactly at the level counts as a break, a high exactly at the level counts as no trade-through at all.
A worked example with real numbers
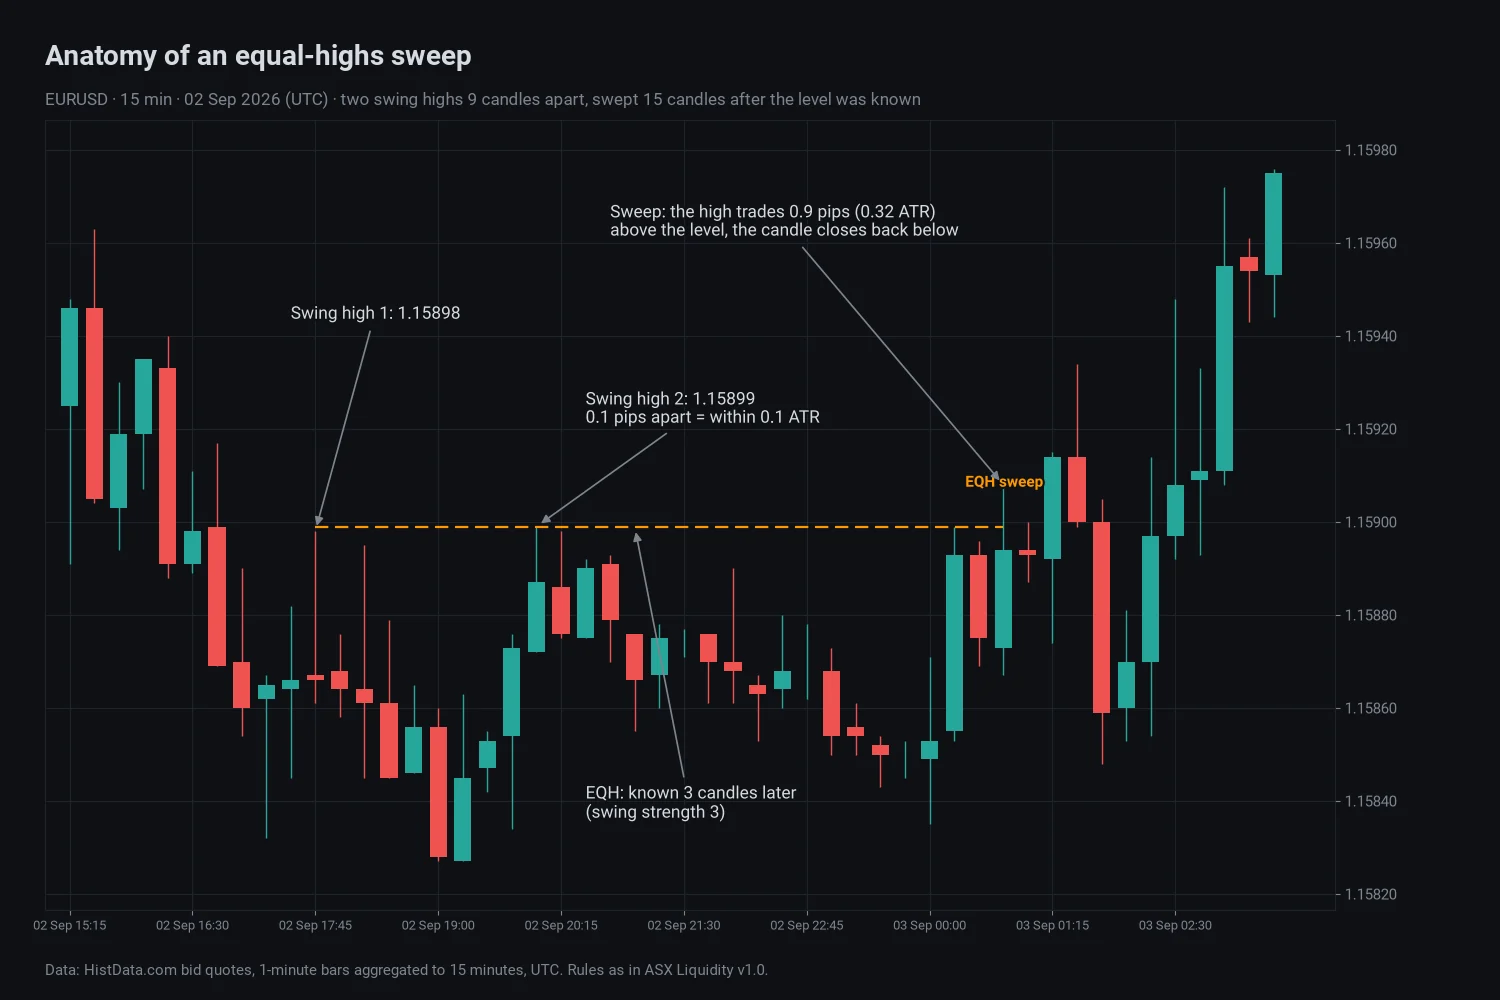
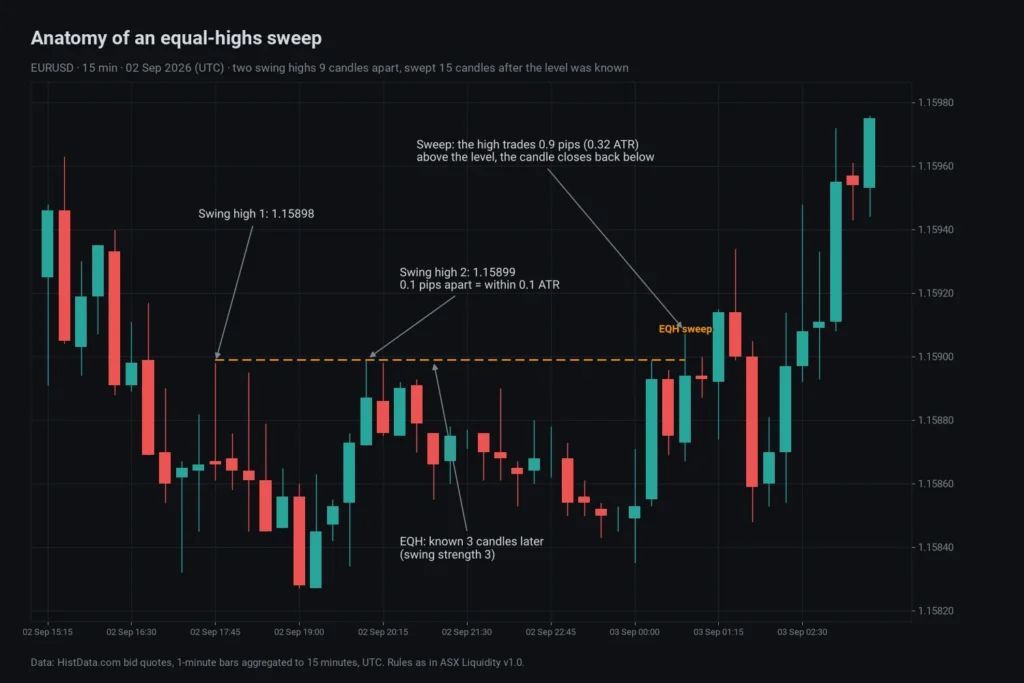
The picture at the top shows EURUSD on the 15-minute chart on 2 and 3 September 2026 (times in UTC):
- At 17:45 a swing high forms at 1.15898. At 20:00 another swing high forms at 1.15899, nine candles later and 0.1 pips higher.
- The second swing is confirmed when the 20:45 candle closes. ATR(14) at that point is 3.8 pips, so the tolerance is 0.1 × 3.8 = 0.38 pips. The two highs are 0.1 pips apart, so they count as equal highs. No candle in between traded above 1.15899.
- From 21:00 on, the equal-highs level sits at 1.15899, the higher of the two.
- At 00:45 on 3 September, fifteen candles later, a candle trades up to 1.15908, 0.9 pips (0.32 ATR) above the level, and closes at 1.15894, back below it. That is a sweep.
- What happened next: with ATR at 2.8 pips, price reached 2.8 pips above the sweep candle’s close (at 01:30, three candles later) before it reached 2.8 pips below. In this example the sweep did not lead to a drop first.
The example is typical in one way: the sweep label describes what one candle did at a level. It does not say what the next candles will do, and our statistics below show why.
How to mark liquidity levels in cTrader
By hand
Use the horizontal line tool from cTrader’s drawing tools. Draw a line at yesterday’s high and low (switch to the daily chart, or read them from the previous day’s candles), and at every pair of swing highs or lows that sit at about the same price. Then watch for candles that close back inside after trading through a line. Drawing by hand works, but “about the same price” changes with your mood, and you will often see a sweep before the candle has closed.
With an indicator
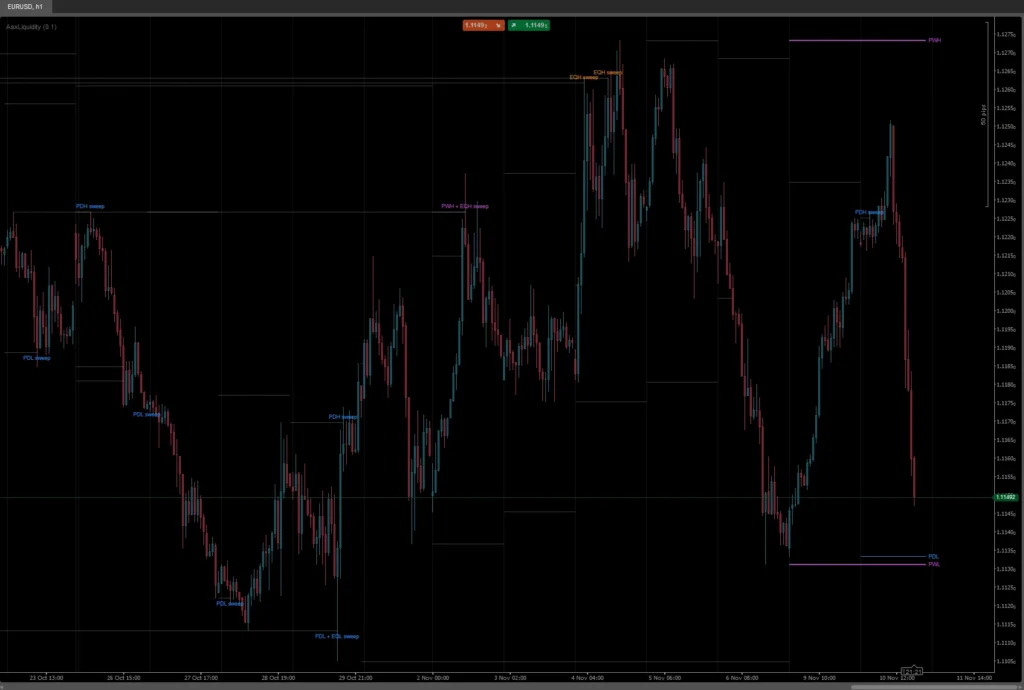
Our free indicator ASX Liquidity for cTrader applies the rules of this guide. It draws equal highs and lows (dashed orange), the previous day’s high and low (blue) and the previous week’s high and low (violet), labels each live level at the right edge, and labels a sweep at the candle that took it. Levels that have been swept or broken stay on the chart as dotted grey lines. It only reads closed candles, so a label does not appear and disappear again. The same rules are available for MetaTrader 5 and TradingView.
What our data shows
We ran the exact rules of the indicator over twelve months of 15-minute candles of EURUSD, gold (XAUUSD) and BTCUSDT, from 1 November 2025 to 31 October 2026, and repeated everything on the twelve months before that as an independent check. The previous day follows the usual forex day that starts at 17:00 New York time for EURUSD and gold, and the UTC day for BTCUSDT. These are price counts only: no spread, no costs and no trading rules.
How often levels are reached. The previous day’s high was traded through during the following day on 44–50 % of days, the previous day’s low on 46–53 %, depending on the market. On average there were 1.6 to 1.8 new equal-highs or equal-lows levels per day on the 15-minute chart.
Sweep or break. At the first trade-through, the candle closed back inside in 41–44 % of cases for equal highs and lows and in 43–49 % for the previous day’s high and low. In the year before, the range was 38–51 %. Breaks were slightly more common than sweeps in almost every market and year.
How far a sweep goes. When a candle swept an equal-highs or equal-lows level, the wick went a median of 0.14 ATR (EURUSD), 0.20 ATR (gold) and 0.31 ATR (BTCUSDT) beyond it, and 90 % of sweeps stayed within 0.6 to 0.8 ATR. Sweeps of the previous day’s or week’s levels went further: a median of 0.19 to 0.42 ATR, 90 % within 0.8 to 1.3 ATR. A stop placed only a few pips beyond an obvious level sits inside the range that ordinary sweeps reach.
What came after a sweep. From the close of each sweep candle we checked whether price first moved 1 ATR back (down after a swept high) or 1 ATR further. We compared that with random candles at the same hour of the day, tested in the same direction.
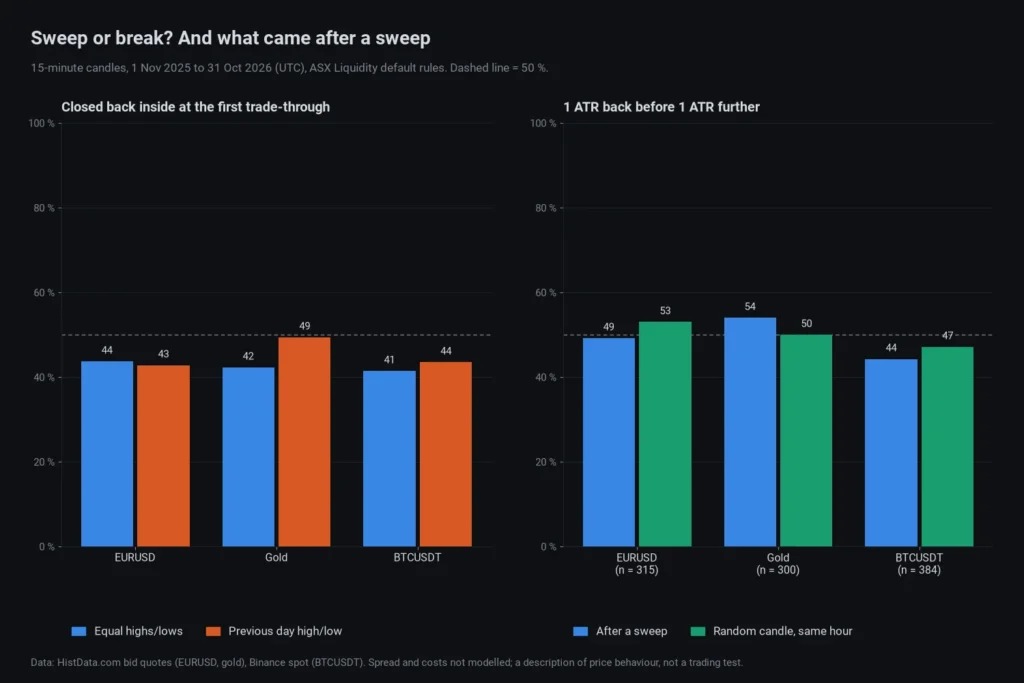
After a sweep, price moved 1 ATR back first in 49 % of cases on EURUSD (315 sweeps), 54 % on gold (300) and 44 % on BTCUSDT (384). Random candles at the same hour gave 53 %, 50 % and 47 %. None of the differences was larger than chance would explain (95 % bootstrap intervals included zero), and the previous year showed the same picture with the signs mixed. Breaks did not reliably continue either: after a close beyond a level, price moved 1 ATR further first in 45–51 % of cases, against 47–53 % for random candles.
Do equal highs attract price? A common claim is that equal highs and lows act as a magnet because so many stops sit there. We compared equal levels with single swing highs and lows that had no equal partner, at the same distance from price.
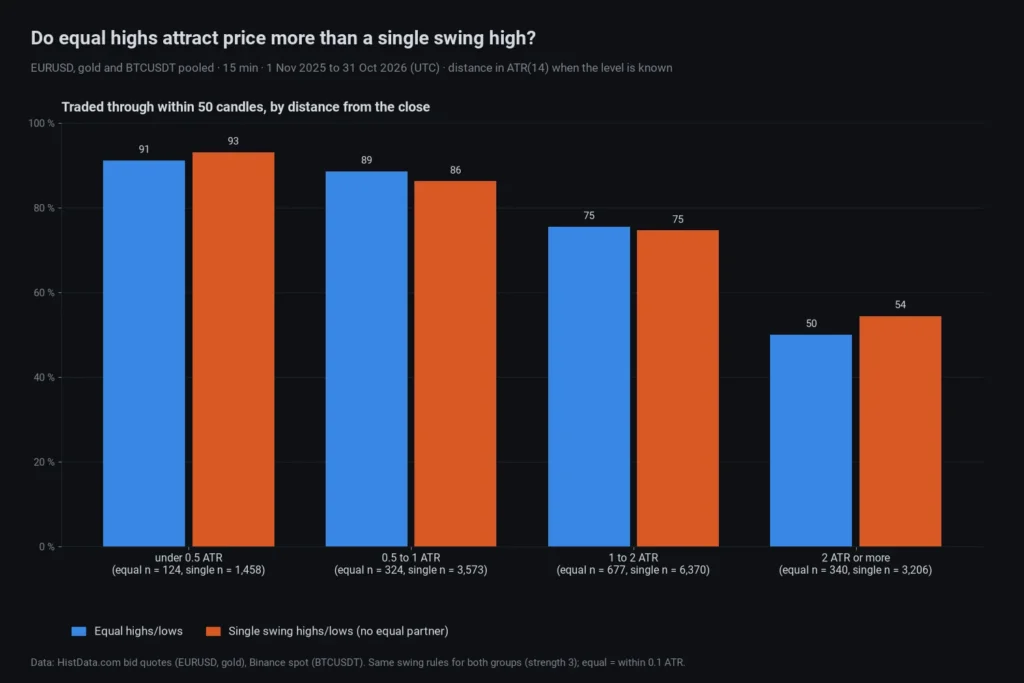
Within 50 candles, 75 % of equal levels that started 1 to 2 ATR away from the close were traded through, and 75 % of single swings at the same distance. Closer and further away the numbers were also within a few points of each other, in both years and all three markets. What mattered was distance, not whether the high was “equal”.
Trading liquidity sweeps: what the numbers do and do not support
Our numbers do not support treating a sweep as a reversal signal on its own. On these markets and this timeframe, a closed sweep candle was followed by a move in either direction about as often as any other candle at that time of day. The pattern is easy to see in hindsight, because the sweeps that reversed are the ones that stand out on a chart; the ones that kept going are easy to overlook.
What the levels can do is describe the chart. They show where obvious stops probably sit, where a move may speed up, and whether the last test of a level closed back inside or beyond it. That is useful for reading a chart and for not placing your own stop at the most obvious price. Whether a sweep fits into a strategy is something to test with your own rules, costs and markets, on a demo account first.
Limitations of this guide and of liquidity indicators
- We measured 15-minute candles on three markets over two years. Other timeframes, markets or periods can behave differently.
- The previous day’s high and low depend on when your broker or data feed starts the day. Two brokers can show different levels on the same symbol.
- “Equal” depends on the tolerance and the swing length. A larger tolerance finds more equal levels, a longer swing length fewer and later ones.
- Equal levels are only known once the second swing is confirmed, three candles after it with the default setting. Anything earlier would be hindsight.
- We do not see actual stop orders. The levels are where stops are likely, not where they are.
- No spread, slippage or commission is modelled. This is a description of price behaviour, not a trading test.
ASX Liquidity: a free liquidity indicator for cTrader, MT5 and TradingView
ASX Liquidity is our free, open-source implementation of the rules above, with the same defaults on every platform: equal tolerance 0.1 ATR, swing strength 3, ATR 14, lookback 500 candles, previous day and previous week levels on. Only the tolerance shows in the chart title.
- ASX Liquidity for cTrader (.algo file plus C# source)
- ASX Liquidity for MetaTrader 5 (.ex5 file plus MQL5 source)
- ASX Liquidity for TradingView (Pine Script v6)
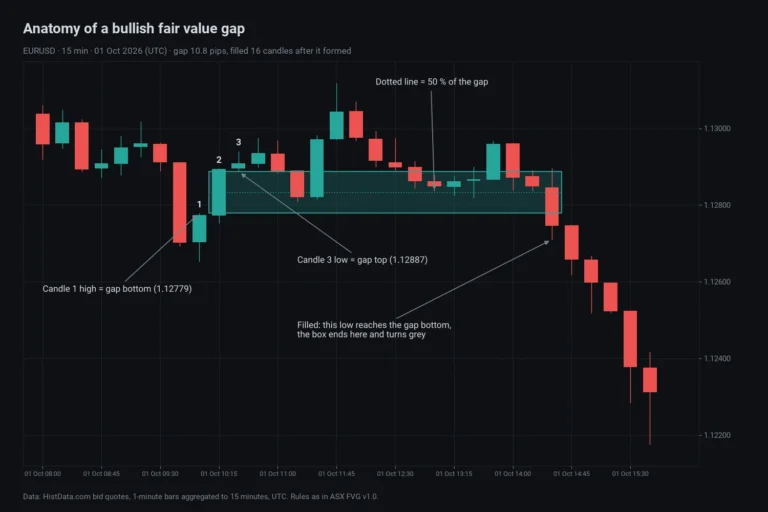
For the three-candle gaps that often appear next to sweeps, see our guide to fair value gaps in cTrader. More free and paid tools are listed on our cTrader indicators page. Trading forex, metals and crypto with leverage can lose you money quickly; liquidity levels describe where price has been, not where it will go.
FAQ
Is a liquidity sweep the same as a stop hunt?
The terms describe the same candle. “Stop hunt” adds the idea that someone moved price on purpose to trigger stops. A chart cannot show intent; it can only show that a candle traded through a level and closed back inside.
Does ASX Liquidity repaint?
No. It only reads closed candles. Equal levels appear once the second swing is confirmed, and a sweep or break is decided at the candle’s close. Once something is on the chart, it stays the way it was drawn.
What tolerance should I use for equal highs and lows?
Start with 0.1 × ATR. At that setting our 15-minute data gave 1.6 to 1.8 equal levels per day. Raise it to 0.2 or 0.25 if you want more levels, lower it to 0.05 if you only want near-exact double tops and bottoms.
Do equal highs get taken out more often than single highs?
Not in our data. At the same distance from price, equal levels and single swings were traded through about equally often within 20, 50 and 100 candles.
Is a sweep a buy or sell signal?
Not on its own. After a sweep, price moved 1 ATR back first about as often as after a random candle at the same hour, in all three markets and both years we measured.
Data and sources (checked November 2026): EURUSD and XAUUSD 1-minute bid bars from HistData.com and BTCUSDT 15-minute candles from Binance public data, aggregated to 15-minute candles in UTC, 1 November 2024 to 31 October 2026 (main period from 1 November 2025, earlier year as a repeat). Stop-loss clustering: C. Osler, Stop-Loss Orders and Price Cascades in Currency Markets, Federal Reserve Bank of New York Staff Report 150 (2002). Rules and numbers as in ASX Liquidity v1.0; 95 % intervals from a day-cluster bootstrap.